Palm Beach County’s housing market reported rising median prices along with reduced listing inventory in May 2018 as compared to May 2017, according to the latest housing data released by Florida Realtors®.
Notable facts from the latest statistics include:
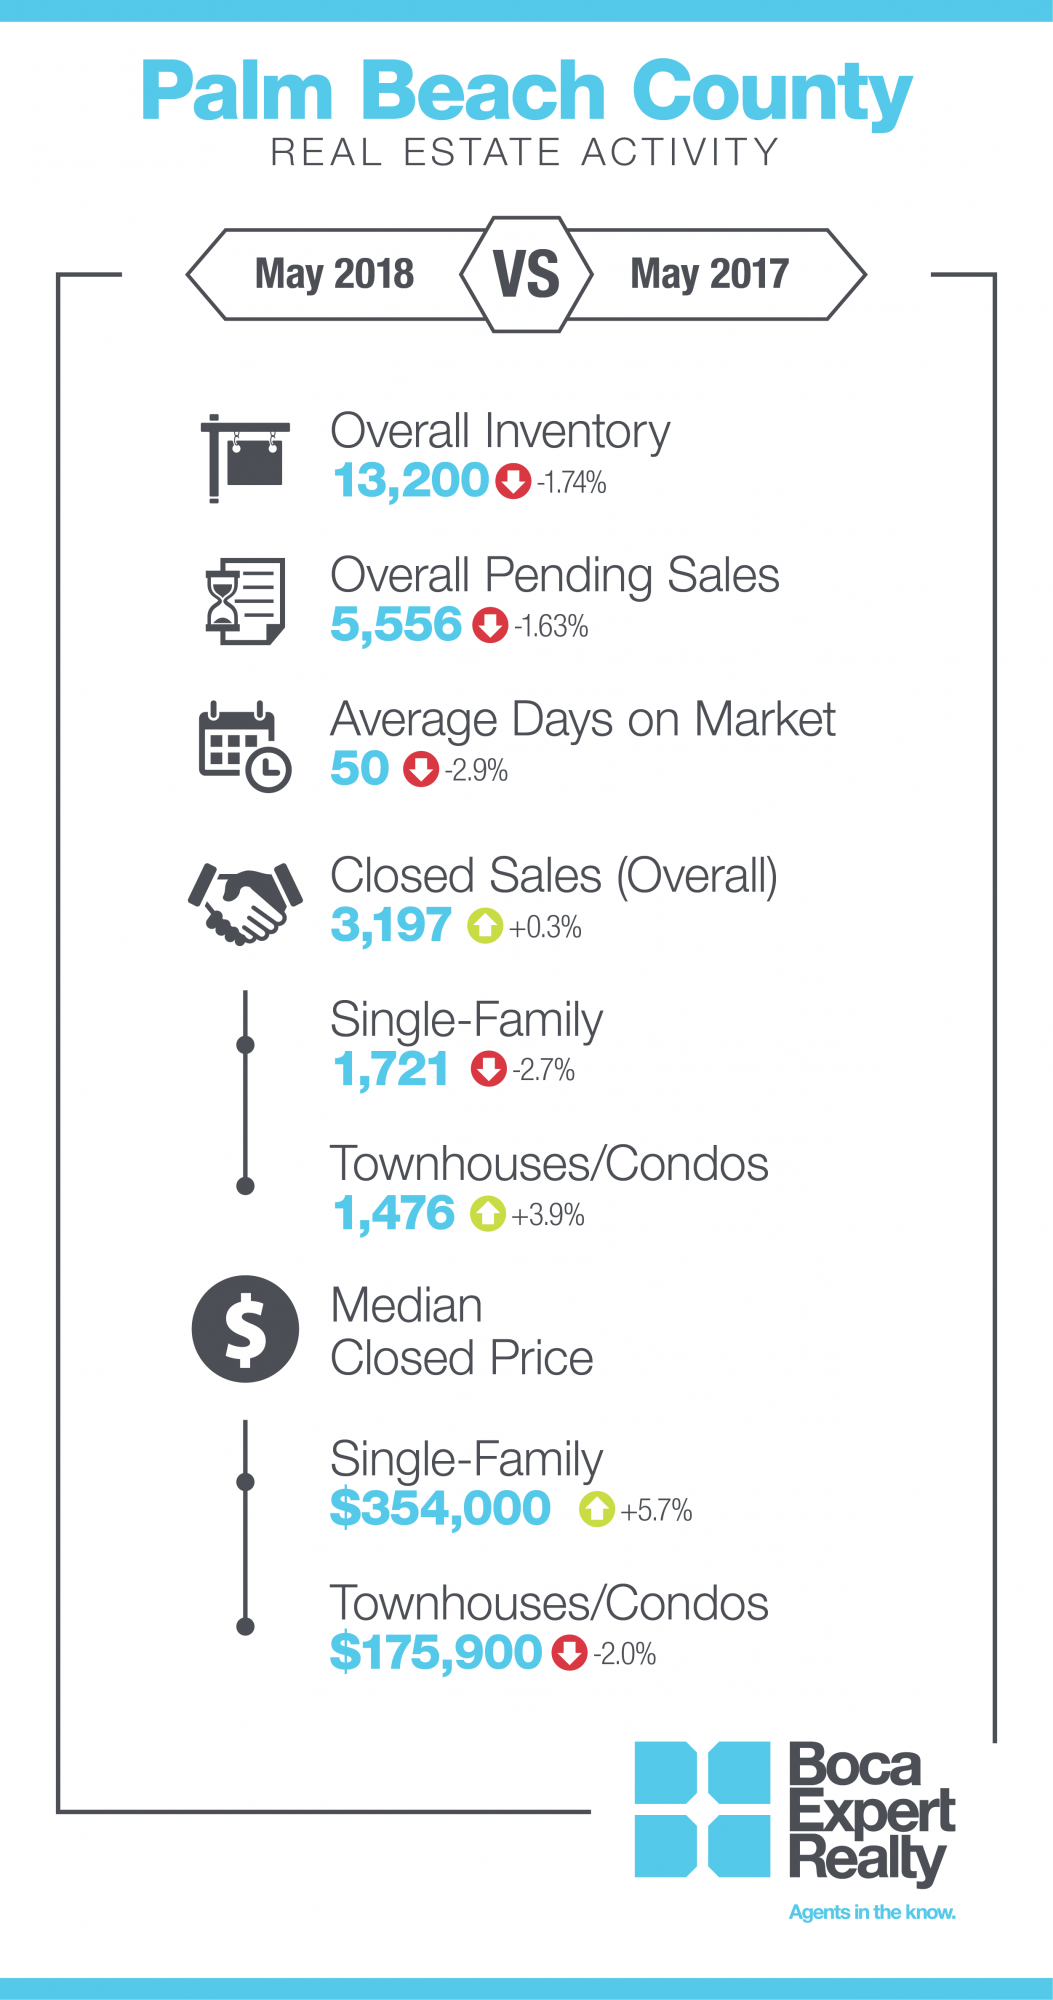
The Market for Single Family Homes and Condos/Townhomes is Different
The median price of closed sales in Palm Beach County for single-family homes continues to rise, with a 5.7% increase from the same period last year. The median price now stands at $354,000 for single-family homes. The median price has increased every month this year for single-family homes.
The median price for condos and townhomes did go down somewhat this month as compared to the previous year, as well as month to month, but it’s perhaps because April’s rise of 10.2% was an aberration, so we will have to continue watching the trends closely.
Inventory Levels Decline
Inventory levels are also on the decline. They continue to decrease both year over year as well as month over month. Combined with a reduction in days on market, this will certainly serve to pressure prices upward.
Pending Sales
Pending sales (homes in contract) are considered a leading indicator of future closed sales. The number of homes which are currently pending has declined. This could be the result of lower inventory levels, as well as increased interest rates. We need to keep our eye on this one in the coming months.
Months Supply of Inventory (MSI)
MSI is a good indicator of market conditions. The benchmark number for a balanced market (favoring neither buyers nor sellers) is 5.5. The latest MSI number for Palm Beach County is 5.5 for condos/townhomes and 4.9 for single-family homes. This is calculated by dividing the current number of homes for sale (inventory) by the number of closed sales (we use a 12 month rolling average to eliminate seasonal effects). These numbers might indicate that our market is healthy and balanced, however it is imperative to examine the particular sub-market and price range for a true and accurate picture. For example, the MSI for single family homes between $250,000-$299,999 is only 2.2 (a strong seller’s market); from $4000,000-$599,999 it is 3.95, from $600,000 to $999,999 it is 6.49; while the MSI for homes above $1,000,000 stands at 13.8 (definitely not a seller’s market there). Generally, the higher the price, the longer it will take to sell, so the market then shifts from a seller’s market to a buyer’s market.
Want to know more?
I’m always here to help you navigate the local market. Whether you are interested in buying or in selling, I can analyze the specific neighborhood and price range for you. Contact me today for a customized look at the latest conditions for the Boca Raton real estate market and beyond.
Posted by Gloria Singer on
Leave A Comment